The current economic expansion entered its 11th year in July (the longest in recorded history) and there are currently enough early warning indicators of recession to justify a quick look at what that means for markets and your portfolio.
What is a recession and why do they happen?
Recessions are officially declared by the National Bureau of Economic Research (NBER), which relies on historical data to make that call. Technically, a recession is defined by two consecutive quarters of economic contraction. That means we don’t know that a recession has hit until during or after the fact; case in point, the NBER didn’t announce December 2007 as the start of the last recession until a full year later in December 2008. During that period, the S&P 500 fell by more than 40%. While most recessions aren’t nearly that destructive, it is worth understanding what the precursors to recession are and preparing a portfolio for the inevitable increase in volatility that accompanies these periods.


Recessions can be caused by any number of reasons; the contraction in 2001 was the result of an asset bubble in technology stocks, while the 2008 recession resulted from excess debt in the housing market. Typically, however, they share a single common denominator: a contraction in spending across the economy. The seeds of a recession can almost always be found in a tight labor market. As unemployment drops and workers demand higher wages, inflation can get a foothold and cause the economy to overheat. To counter this, monetary authorities (the Federal Reserve) tighten policy by raising short-term interest rates. As rates rise, consumers (households, businesses, and governments) cut back their spending. Almost invariably the Fed over-does it, resulting in a sharp decline in economic activity and, typically, a recession. Excessively tight monetary policy is the single most common cause of recessions in the post WWII period.
Where are we now?
During our current expansion, the Fed started raising interest rates in late 2015, ending with a total of nine hikes by December of 2018. This interest rate cycle differs from previous ones, however, in that it happened in the absence of any hints of inflation. Rather than trying to control a runaway economy, the Fed has been focused on sopping up all of the excess monetary stimulus left over from the Great Recession. The concern has been that with too much excess money in the system there is an elevated risk of sparking an asset bubble that could derail the economy. The Fed also believes that such a tight labor market could lead to surprise inflation.
While it’s nearly impossible to pinpoint the date of the next recession, we know that Fed tightening has meaningfully slowed economic activity. Tax cuts in late 2017 helped mute some of this impact and may have extended the expansion a bit, but other factors have since come into play. Policy-making uncertainty (namely the revival of protectionist trade policies) has led directly to slowing manufacturing and export growth across the globe and, by August 2018, we began to see the early signs that a recession was in the making:
Equity market volatility: higher interest rates, tighter liquidity and a slowing economy bring into question corporate profits, causing equity market volatility to pick up well in advance of an actual recession. On average, this can afflict markets as much as twelve months before the onset of recession. This is also the time in the economic cycle when companies are more highly leveraged, which further contributes to share price volatility. Since August of 2018, the market has registered a sharp increase in volatility, with the largest decline in share prices exceeding 19% last Fall.
Trade policy: Starting in January 2018, the Trump administration began shifting trade policy from multilateral free-trade agreements toward more bilateral deals and began imposing steep tariffs on foreign goods from a number of major trading partners. Many trading partners have reciprocated with their own tariffs on US goods or, more subtly, improved their terms of trade by weakening their currencies (making their export goods cheaper) to make up for the impact on exports. Initially viewed as negotiating tactics, these behaviors are becoming entrenched. Just as Smoot-Hawley tariffs imposed in 1930 severely amplified the Great Depression, we are already seeing the adverse effect tariffs are having on global growth.
Housing: Some economists say housing IS the business cycle, because nearly every recession since WWII has been preceded by problems in housing and consumer durables. We look to private domestic fixed investment which captures much of this activity; it turned sharply lower as early as Q1 2006, foreshadowing the pain in housing markets before the last recession. As of Q2 2018, for the first time since the Great Recession, this indicator has plateaued indicating that this large chunk of the economy is no longer an engine of growth.
The Output Gap: During and after every recession, the economy goes through a period when it operates below full capacity. The difference between where it could be operating (based on available labor, capital and technology), and where it is operating is called the output gap. Over the course of an expansion, that gap narrows and eventually closes. The Fed becomes concerned about overheating when actual output exceeds potential output. The US economy has exceeded potential output since late 2017, indicating a reversion (e.g. slowing) to potential output sometime in the medium term.
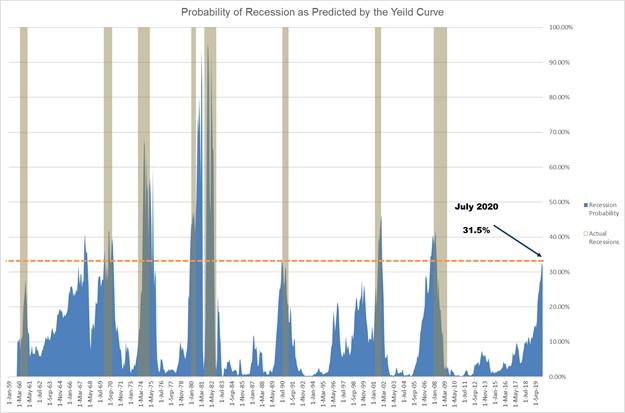
The Yield Curve: Debt markets have been among the best indicators of impending recession, predicting every recession in the past 40 years. When short-term interest rates (controlled by the Fed) rise above longer-term rates (controlled by market forces), banks have less incentive to lend, eventually leading to depressed economic activity. This so-called ‘inversion’ of the yield curve typically precedes a recession by 12-18 months. A yield curve inversion does not guarantee a recession, but it is a strong harbinger of recession risk. Today, the yield curve is sending a strong signal that a recession may be around the corner:

With that in mind, what are the practical implications of an impending slowdown or full-blow recession? While each recession is different, a recession’s effect on asset markets are well known. In the following section, we detail how we are positioning portfolios to adapt to developing economic conditions:
-
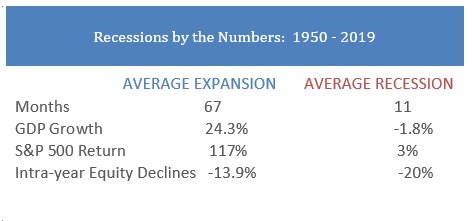
- Equities: As we already know, equity market volatility rises during a recession. On average, equity markets decline by about 20% from peak to trough during a recession (that compares to an average 13.9% intra-year decline during normal years). However, this average masks important aspects of equity market behavior before, during and after a recession. Much of a market’s losses actually occur in the six months prior to a recession while much of the latter stages of a recession are characterized by strong equity market performance (in the last recession, for instance, equity markets peaked in October 2007 and bottomed in March 2009. By the time the recession was officially over that following June, equities had rallied more than 30% off of their bottom). As such, our approach to equity investing during this transitionary period is less focused on timing recession dates and more focused on managing volatility and liquidity during these choppy periods. We do this by having a larger than usual allocation to low-correlation growth strategies. This includes low-volatility strategies that focus on the higher-quality, more liquid and less volatile elements of the market. Typically, we expect to experience anywhere from 50% to 70% of the market’s ups and downs, significantly blunting the highest-risk part of portfolios.
-
- Credit: Bankruptcies rise before and during a recession as consumers and companies struggle to pay their bills. We view corporate credit with a skeptical eye during this period, preferring instead only the highest quality bonds for the defensive side of portfolios. This means US treasuries and shorter-dated bonds from high-quality issuers, especially in defensive and less-cyclical issuers. We are particularly wary of leveraged loans given the glut of low-quality issuance in recent times. We also have a higher than usual allocation to cash for dry powder.
-
- Interest Rates: Bonds play a number of roles in a portfolio, including income, capital preservation, and inflation protection. During a recession, interest rates become more volatile and bonds’ most important role in the portfolio becomes capital preservation, helping to diversify from negatively correlated equities. In the past year, we have added to our core defensive positions, reducing credit exposure and increasing exposure to longer-term, high quality bonds that can offset the sharp swings in equity markets. This has been in the form of more exposure to the broad Barclay’s Aggregate Index, and to longer-dated US treasuries.
As always, we are continually stress testing portfolios for exposures to other risk factors that may be at play below the surface. Our vigilance can help mitigate the effects of an economic downturn by limiting surprises and avoiding the major potholes that can emerge during these periods. Ultimately, of course, we cannot completely immunize portfolios from all recession-related volatility. It is important to remember during this period that recessions are relatively small blips in economic history; the average recession lasts just eleven months while the average expansion spans 67 months. Furthermore, while the average equity market drawdown during a recession is roughly 20%, equity returns on average have still been positive over the full length of a contraction because many of the strongest rallies have occurred during the late stages of recession. 2019 has been an exceptional year so far for strong risk adjusted returns; as the economy decelerates and may even tip into recession, we would expect these returns to be more muted and more volatile, but well within the norms of historical averages.


